


HD_s-SNOM_1-pass
Advanced Scattering Scanning Near-field microscopy
Thanks to high-speed HybriD 2.0 Control Electronics the approach and withdrawal optical response signal curve (PMT) can be recorded and processed in real-time. This allows to separate the near-field from far-field component of optical response and to map it with spatial resolution limited by the tip radius.
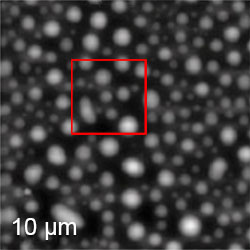
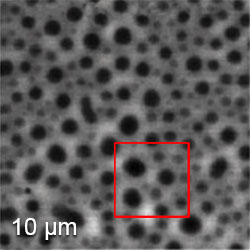
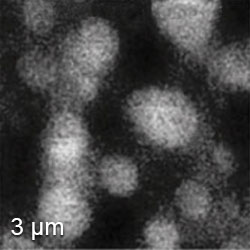
Here we demonstrate its application to PS/PBD polymer blend study with less than 100 nm optical resolution.
We have expanded this method by employing an altemative scheme for the detection of the near-field and far-field responses with the use of Hybrid (HD) AFM mode. In HD mode the sample is brought to the intermittent contact with the tip in a periodic oscillation at a frequency (1-2 kHz) much smaller than the probe resonance. In every oscillation cycle the probe deflection to a set-point value is used for surface profiling. For optical measurements the metal coated AFM tip was top-illuminated by visible laser. Simultaneously with surface profiling the light scattered from tip-sample junction was collected by a sensitive photomultiplier (PMT). The homodyne optical signal detection scheme was applied to discriminate near- and far-field optical components. Our method was verified by the studies of various materials (semiconductors, metals, polymers, etc.). The presented results show that the contrast of ASNOM images can be used for compositional mapping of heterogeneous systems.
In contrast to conventional high frequency ASNOM operations, the use of ASNOM/HD approach requires measurements at much lower frequencies. This facilitates the better signal-to-noise ratio and improved sensitivity. Furthermore, the increased optical signal accumulation time provides a more flexible choice for signal analysis. Particularly, the dependence of optical response on tip-sample separation in every point of a chosen sample area can mapped during real-time scanning and analyzed by a proper theoretical model. This is better than the simplified analysis based on the single frequency lock-in amplifiers detection of higher harmonics [2, 17,18]. One additional analysis possibility is the use of the Fourier transform and its proceeds. In practice, we have performed the detection of optical signal by these different approaches on a variety of materials (semiconductors, metals, polymers, etc.) and the results confirmed the high-spatial resolution of optical detection. Implementation of ASNOM/HD approach enhances the capabilities of comprehensive studies of materials at small scales as we demonstrate by the following examples.
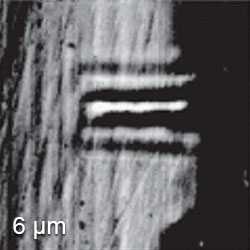
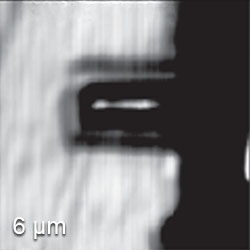
The applications of ASNOM/HD are illustrated by the images obtained in studies of semiconductors, metals and polymer materials. All the scan frames are 512x512 pixels and obtained with a regular AFM scan rate (~ 12 minutes for the frame). The same AFM tip could be used for investigation of several samples producing multiple data frames with no quality compromise. In the first example, we are considering the results of the ASNOM/HD measurements of CMOS (complimentary metal-oxide semiconductor) structure, which was prepared in a cleaved-edge geometry, are combined with the examination of the same sample area with single-pass Kelvin force microscopy (KFM) mode and with HD mode, Figure 1.

Topography
s-SNOM 3rd Harmonic
Total Scattering
Such multi-mode analysis of the samples is the basis of comprehensive material characterization. In all three modes, the topography images show a relatively smooth surface with multiple polished grooves and few contamination particles. The total scattering map exhibits spatial intensity variations of the signal comprising the far-field and near-field components whereas the map of 3nd harmonic can be assumed exclusively to the near-field effect. In general, both maps (Figure 1) reflect the doped structure, which is not distinguished in the height images, yet the spatial resolution of the near-field map is much higher.
Topography
Peak-Baseline Intensity
HD s-SNOM 2nd Harmonic

HD s-SNOM 3rd Harmonic
References
- Magonov, Sergei N. Surface Analysis with STM and AFM. Experimental and Theotetical Aspects of Image Analysis.VCH 1996.